MERS-CoV structural mutation database

Explore MERS-CoV proteome mutations in genomic and 3D structural context.

This database links MERS-CoV amino-acid mutations to viral proteins, PDB structures, AlphaFold models, chain-specific residue annotations, and an interactive Mol* viewer. It is designed to help users move from genome-level mutation patterns to protein-specific structural interpretation.

Step 1Select gene
Step 2Inspect variants
Step 3Open structure
Step 4Map in 3D
Gene-level entry point

Select a MERS-CoV protein from the genome overview.

The home page groups MERS-CoV proteins by viral component, including replicase/non-structural proteins, structural proteins, accessory proteins, and other proteins. Clicking a gene segment opens the dedicated gene page for that protein.

  • Sunburst navigation: provides a compact overview of the viral proteome.
  • Component grouping: separates replicase, structural, accessory, and other proteins.
  • Direct routing: each outer segment opens a protein-specific mutation and structure page.
This view is useful for quickly moving from genome organization to a specific protein such as spike, nsp5, nsp14, or nucleoprotein.
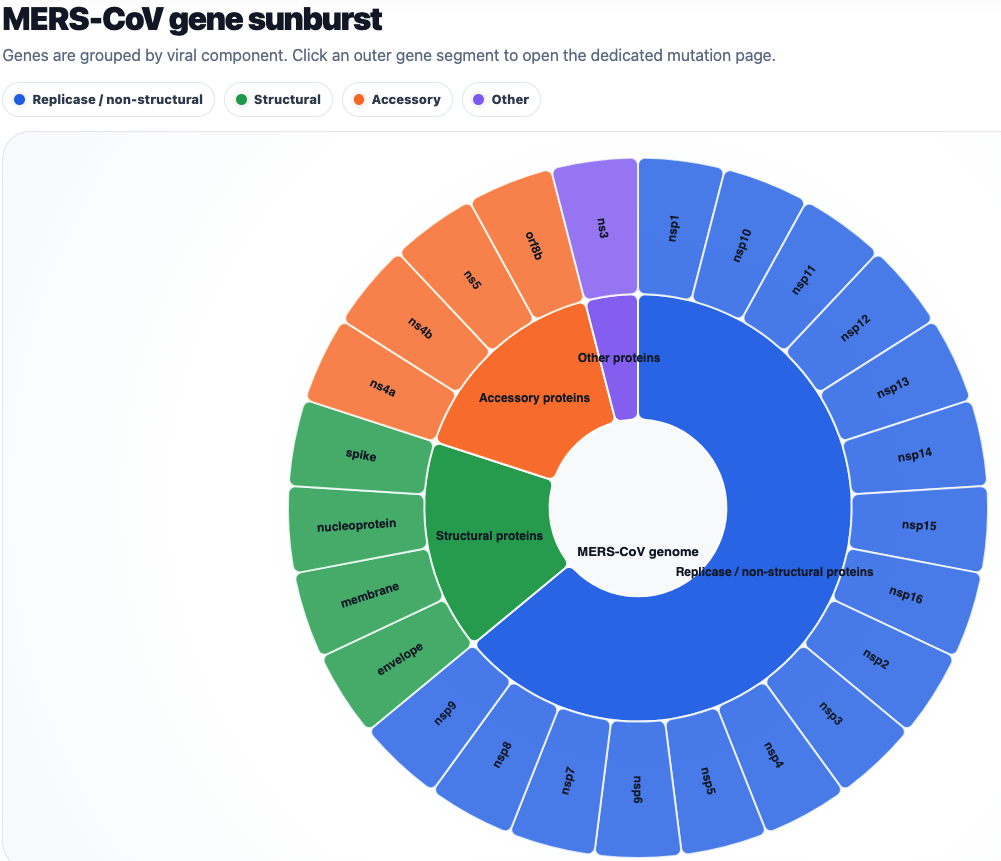
MERS-CoV gene sunburst home page
Genomic mutation table

Inspect protein-specific mutations with epidemiological metadata.

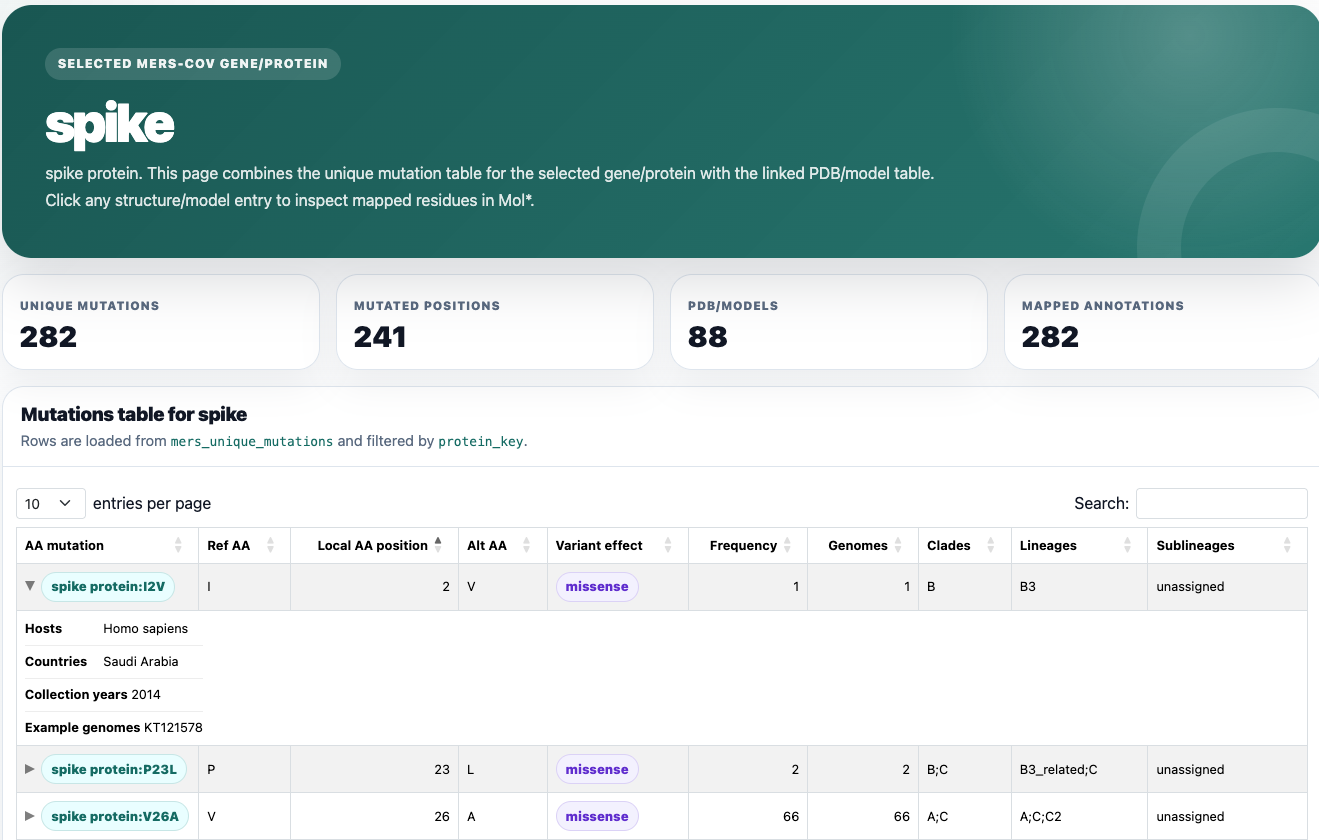
The gene page starts with a mutation table filtered by the selected protein. Each row represents a local amino-acid mutation and includes genomic context such as frequency, genome count, clade, lineage, host, country, collection year, and example genome identifiers.

  • AA mutation: protein-specific amino-acid substitution label.
  • Variant effect: missense, stop codon, deletion, insertion, synonymous, or other.
  • Genomic metadata: frequency, genome count, clades, lineages, hosts, countries, and collection years.
  • Search and sorting: DataTables controls allow rapid filtering of large proteins such as spike and nsp5.
MERS-CoV gene mutation table
Structure/model browser

Open PDB structures and AlphaFold models linked to the selected protein.

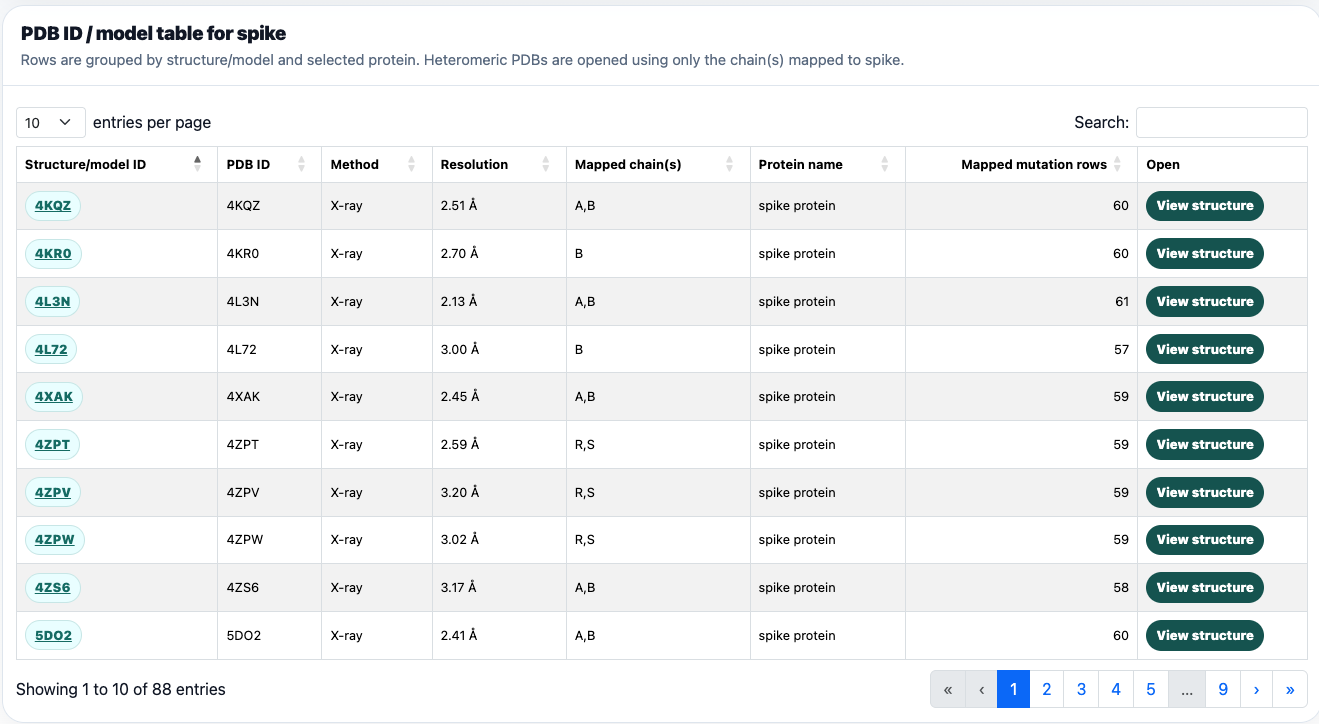
The PDB/model table lists structures mapped to the selected MERS-CoV protein. Heteromeric structures are handled using chain-specific mapping, so a structure such as an nsp10/nsp14 complex can be opened from either protein while displaying only the chains and mapped mutations relevant to the selected gene page.

  • Structure/model ID: PDB ID or local model identifier.
  • Mapped chains: chain IDs assigned to the selected protein.
  • Mapped mutation rows: number of structure-level mutation annotations available for the selected protein and chain(s).
  • View structure: opens the structure page with the selected protein context preserved.
This chain-specific approach prevents heteromeric structures from mixing mutations between different viral proteins.
MERS-CoV PDB and model table
Structure-level annotation summary

Summarize mapped residues before exploring the 3D model.

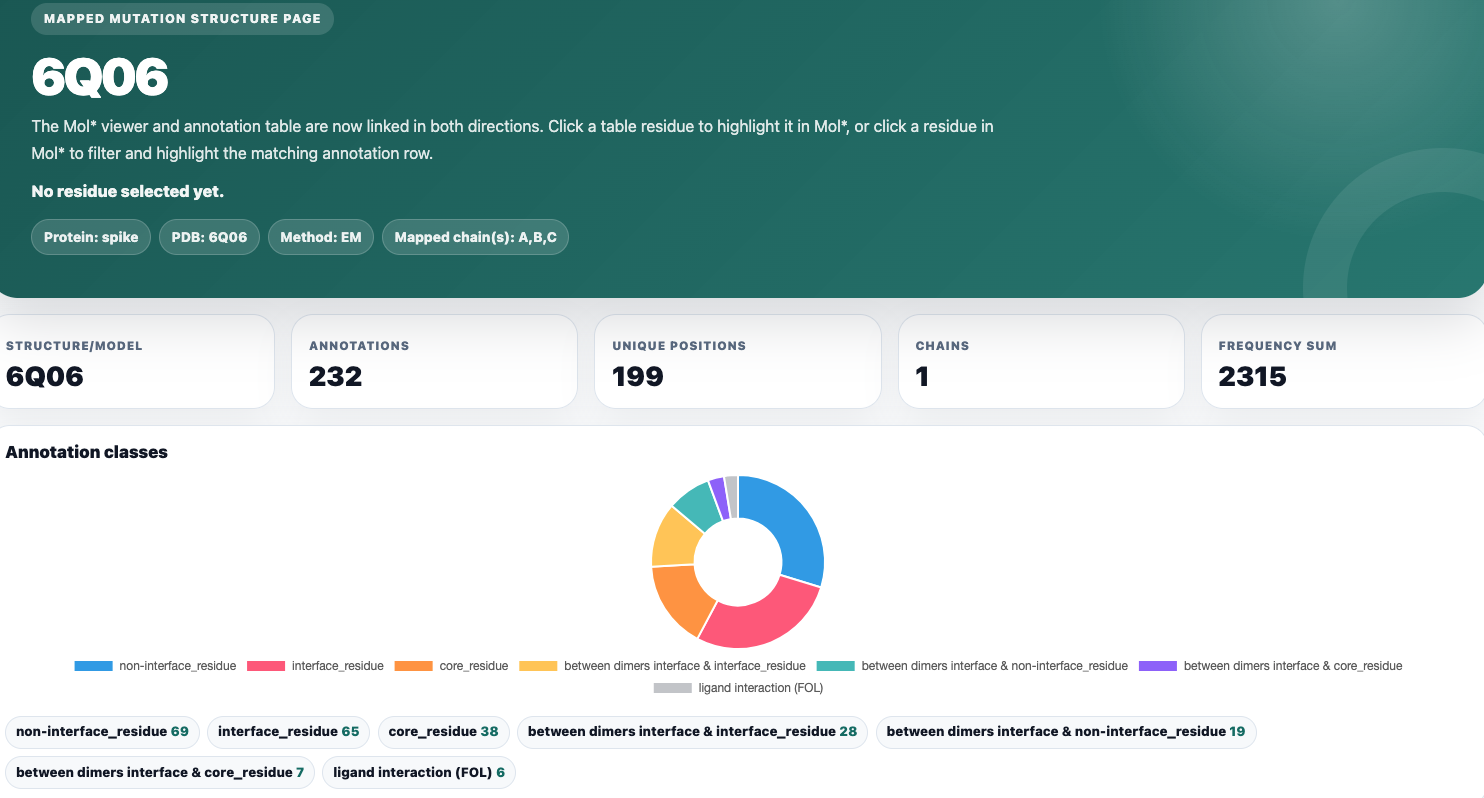
The structure page provides a summary of the selected structure or model, including the number of mapped annotations, unique residue positions, mapped chains, and frequency sum. Annotation classes are summarized with a chart and compact count labels.

Mapped residues Counts the mutation rows mapped onto the selected structure and protein context.
Annotation classes Shows structural categories such as interface, core, non-interface, ligand interaction, or dimer interface.
Chain specificity Restricts results to the chain or chains assigned to the selected MERS-CoV protein.
MERS-CoV structure summary page
Interactive 3D interpretation

Link the mutation table directly to the Mol* structure viewer.

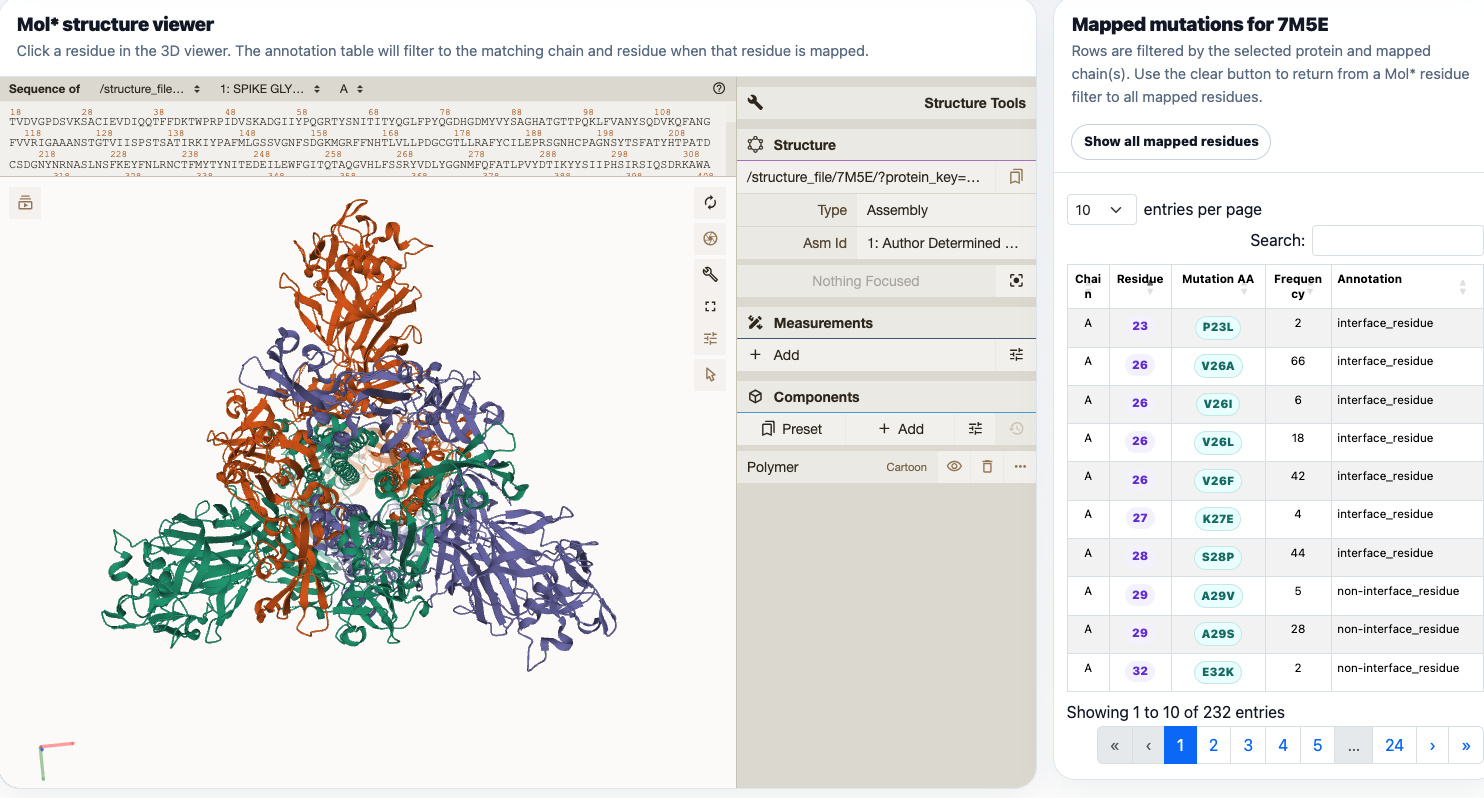
The lower structure-page panel links the mapped mutation table with Mol*. Selecting a table residue highlights the corresponding chain and residue in the 3D viewer. Clicking a residue in Mol* can also filter the table to the matching mapped annotation row.

  • Table-to-viewer: clicking a residue sends chain, residue number, and mutation information to Mol*.
  • Viewer-to-table: clicking a residue in the viewer filters the annotation table when the residue is mapped.
  • Large viewer layout: the Mol* panel uses most of the horizontal space, with the mutation table kept beside it.
  • Structure context: users can inspect whether mutations occur at interfaces, buried cores, ligand sites, or exposed surfaces.
1. Choose proteinStart from the sunburst or gene list.
2. Review variantsInspect genomic frequency and metadata.
3. Open structureSelect a mapped PDB or model.
4. Select residueClick the mutation row or viewer residue.
5. Interpret siteAssess the mutation in 3D context.
MERS-CoV Molstar viewer and mapped mutation table